presman – Oracle Resource Manager Monitor

I’ve been working a lot with DBRM lately and the worst thing is feeling that we can’t properly measure our plan directives and how effective our DBRM plans are in real world.
I’ve decided to learn more about Python so i did a try in writing a tool to monitor my DBRM complex implementations and plans.

presman is a small tool, that works with Python >2.6 and cx_Oracle. It was tested on Linux and MacOSX Yosemite (10.10.x). It works on your favorite terminal and no more is needed.

As soon as you install Python (if needed) and cx_Oracle you are ready to go. Please remember that for MacOSx you have to build cx_Oracle. I will provide detailed instructions on how to build it in near future.

Some of the features are:

1) Measure your CPU usage and Session I/O by Consumer Group;
2) Show real time table and bar chart with a configurable refresh time;
3) Export measured data to a CSV to easy manipulate;
4) Configuration is easy and straightforward.

Before run it, check the configuration file config.ini that contains a few options:

[presman]
connection_string=system/oracle@192.168.56.102/bacodb1
option=cpu
refresh_rate=3

– Available options are cpu and session_io. Default is cpu;
– Refresh rate is the rate for screen refresh. Minimum allowed is 3 seconds;
– The connection should be made using an Oracle user that is allowed to query DBA_ and V$ views from DBRM. SYSTEM is recommended.

To run it you have two different options. The second option is to output the measured on chart to a CSV:
– For cpu option the output is the % of CPU Usage by Consumer Group;
– For session_io option the output is the % of Consumed I/O (Small and Large Read and Write I/O) by Consumer Group.

lcarapinha@Luiss-MacBook-Pro:~/$./presman.py 
lcarapinha@Luiss-MacBook-Pro:~/$./presman.py output_plan.csv

Here is the first screenshot of presman in action using cpu option. Please note that in the top of the image you have several information regarding your database.
The table shows several information about CPU Usage by Consumer Group, for example the number of yields, active session or requests.
As you can see, it allows you to measure with your defined refresh rate how DBRM is allocating the CPU resource and check if that really matches with your implementation.

presman shot

The next screenshot will show presman in action using session_io option. This option allows us to check I/O consumed by Consumer Group. DBRM is not able to “limit” your I/O but you can measure the distribution of the I/O by Consumer Group and how your DBRM plan can influence that.

presman_session_io

If you opt to output the measured values (see what is saved in top of this post) to a file, you can use the CSV to create fancy graphics like this one (with refresh rate 10 seconds):

graphics_cpu

The same applies to session_io option:

graphic_session_io

Please make note of the following restrictions on 1.0 version:
– No RAC support (yet)
– Not tested in Windows platform

I will release it soon in a new “page” in the blog as i have one “performance” bug fixed when presman runs for several hours and need to output to file.
For now code is available in github here: https://github.com/lcmarques/presman

Profiling DB Resource Manager – VKRM process

It seems that VKRM is a deeply unknow background process. I did a little investigation that will help to understand better all mechanism of profiling Oracle (Thank you Frits Hoogland) and a little more of one of the most underestimated feature of Oracle: Resource Manager.

VKRM manages the CPU scheduling for all Oracle processes and includes the CPU scheduling for the Database Resource Manager. Your DBRM active plan (parameter resource_manager_plan) will be subject to VKRM job to ensure that all your plan directives are fulfilled.
VKRM is a special background process, because it just go away when is not needed (at least in 11gR2) and every time your Resource Manager CPU scheduling kicks in, DBRM process will spawn VKRM again. Please note that DBRM is the “main” process for all Resource Manager tasks, VKRM is only for CPU scheduling.

There is no documentation explaining how VKRM works in detail, so what is left for us is to try some profiling and reach some (basic?) conclusions.

The first thing about VKRM is that, you simply can’t control its behavior…except there is an hidden parameter called _vkrm_schedule_interval exists which is basically VKRM schedule interval (surprise, surprise) that is by default set to 10 milliseconds:

SQL> @phidden _vkrm

KSPPINM 					   KSPPSTVL
-------------------------------------------------- --------------------------------------------------
_vkrm_schedule_interval 			   10

This is easily confirmed by strace on the PID corresponding to VKRM background process:

[oracle@baco scripts]$ ps -ef | grep ora_vkrm
oracle    2566     1  0 Nov01 ?        00:00:25 ora_vkrm_bacodb1
oracle    8965  7296  0 01:02 pts/3    00:00:00 grep ora_vkrm

[root@baco scripts]# strace -p 2566 -o ora_vkrm_strace.out
Process 2566 attached - interrupt to quit
^CProcess 2566 detached

The result is a bunch of nanosleep() Linux kernel functions, that suspends the execution of a calling thread until either at least the time specified (10000000 nanoseconds) has elapsed. On easy words, it is holding a sleep for every 10 milliseconds. On a successful sleep, nanosleep() returns 0.

nanosleep({0, 10000000}, 0x7fff271b1160) = 0

A small change in the _vkrm_schedule_interval to 5000 milliseconds will result in a different argument call for nanosleep() function and on a different period (every 5 seconds).
This will probably change the behavior of VKRM and CPU scheduling, the greater the value, the less precise will be your scheduling. As you can see in strace output it is possible to change _vkrm_schedule_interval while database is running (scope=memory) and it will take immediate effect on your scheduling behavior:

SQL> alter system set "_vkrm_schedule_interval"=5000 scope=memory;
SQL> alter system set "_vkrm_schedule_interval"=6000 scope=memory;
nanosleep({0, 10000000}, 0x7fff271b1160) = 0
nanosleep({5, 0}, 0x7fff271b1160)       = 0
nanosleep({6, 0}, 0x7fff271b1160)       = 0

Trace files will also reveal your change:

*** 2014-11-02 04:02:43.992
kskvkrmschedintmod: setting VKRM scheduling interval from (6000)ms to [(10)ms (10000)us]
*** 2014-11-02 04:11:53.078
kskvkrmschedintmod: setting VKRM scheduling interval from (10)ms to [(5000)ms (5000000)us]
kskvkrmschedintmod: setting VKRM scheduling interval from (5000)ms to [(10)ms (10000)us]

Another chapter in profiling VKRM process is to use perf on Linux to see if we can see more interesting stuff. Bellow is the result of a perf report against VKRM process. Top 3 are three different kernel mode executed functions: __do_softirq, finish_task_switch and _raw_spin_unlock_irqrestore.
Most of the work is done in kernel mode, with Linux kernel software interrupts (softirq) and scheduler functions (finish_task_switch) allowing the high-precision CPU scheduling made by VKRM.
Another thing worth mention is usermode Oracle function kskvkrmmain representing only 3.03% of all work done by VKRM.

root@baco outputs]# perf record -g -p 2542 -e cpu-clock
[ perf record: Woken up 2 times to write data ]
[ perf record: Captured and wrote 0.451 MB perf.data (~19697 samples) ]

[oracle@baco outputs]$ perf report
[vdso] with build id 553f611ad979d16f78a66945dca52ba113827329 not found, continuing without symbols
...
 39.24%  ora_vkrm_bacodb  [kernel.kallsyms]   [k] __do_softirq
                 -- 99.05%-- do_nanosleep
...
34.31%  ora_vkrm_bacodb  [kernel.kallsyms]   [k] finish_task_switch
...
14.22%  ora_vkrm_bacodb  [kernel.kallsyms]   [k] _raw_spin_unlock_irqrestore
...
3.03%  ora_vkrm_bacodb  oracle              [.] kskvkrmmain
            |
            --- kskvkrmmain
                ksbrdp
    ...

1.25%  ora_vkrm_bacodb  oracle              [.] sltrusleep
            |
            --- sltrusleep
                kskvkrmmain
   ...

Another shot is oradebug to understand what kind of events happen related with VKRM:

SQL> oradebug setospid 2542
Oracle pid: 10, Unix process pid: 2542, image: oracle@baco (VKRM)
SQL>  oradebug unlimit
Statement processed.
SQL> oradebug event 10046 trace name context forever, level 8;
Statement processed.

*** 2014-11-09 14:06:38.559
WAIT #0: nam='latch free' ela= 21980 address=2722482696 <b>number=467</b> tries=0 obj#=-1 tim=6866775549

*** 2014-11-09 14:09:41.598
WAIT #0: nam='latch free' ela= 31774 address=2722482696 <b>number=467</b> tries=0 obj#=-1 tim=7049814301

The only event that is happening on this trace is latch free wait event.It is possible to identify what latch is related with latch free wait event with a simple query (see bellow). The latch is obviously related to Resource Manager CPU scheduling.

SQL> select latch#, name from v$latchname where latch# = 467;

    LATCH# NAME
---------- ----------------------------------------------------------------
       467 resmgr:resource group CPU method

This post has no great conclusions, it is just a pure exercise to understand a little more about a deeply unknow Oracle background process.

Resource Manager – CPU allocation math – Part 3

This is the last post of this mini-series regarding CPU allocation in Resource Manager. The idea behind this last post is very simple: Tracing the same test case we’ve used before and analyze trace files. This will let us understand how Oracle instrumentation works when DBRM is active and managing the CPU.
Please note that we are going to trace for only one service, that is perfectly enough for our testing.

Changing our cpu_alloc_burn.sql for tracing using 10046 event with the prefix for our traces ‘DBRM_TRACE’:

SET TERMOUT OFF
alter session set tracefile_identifier='DBRM_TRACE';
alter session set events '10046 trace name context forever, level 12';
select distinct t1.N2 from t1, t2
where t1.N1t2.N2
and t1.N3t2.N1
and t1.N2  t2.N1
and t2.N2 is not null;
[oracle@phoenix resource_manager]$  ./run_adhoc.sh
Starting 20 new executions for S_ADHOC service with tracing...

Now we have 20 new sessions connected to the service name S_ADHOC and consumer group ADHOC_QUERYS. The first thing that we will notice before digging into trace files is the wait event resmgr:cpu quantum:


      SID STATUS   RESOURCE_CONSUMER_GROUP	     SERVICE_NA EVENT
---------- -------- -------------------------------- ---------- ------------------------------
	22 ACTIVE   ADHOC_QUERYS		     S_ADHOC	resmgr:cpu quantum
	24 ACTIVE   ADHOC_QUERYS		     S_ADHOC	resmgr:cpu quantum
	26 ACTIVE   ADHOC_QUERYS		     S_ADHOC	resmgr:cpu quantum
	28 ACTIVE   ADHOC_QUERYS		     S_ADHOC	resmgr:cpu quantum
	29 ACTIVE   ADHOC_QUERYS		     S_ADHOC	resmgr:cpu quantum
	32 ACTIVE   ADHOC_QUERYS		     S_ADHOC	resmgr:cpu quantum
	34 ACTIVE   ADHOC_QUERYS		     S_ADHOC	resmgr:cpu quantum
	35 ACTIVE   ADHOC_QUERYS		     S_ADHOC	resmgr:cpu quantum
	38 ACTIVE   ADHOC_QUERYS		     S_ADHOC	resmgr:cpu quantum
       134 ACTIVE   ADHOC_QUERYS		     S_ADHOC	resmgr:cpu quantum
       136 ACTIVE   ADHOC_QUERYS		     S_ADHOC	resmgr:cpu quantum

       SID STATUS   RESOURCE_CONSUMER_GROUP	     SERVICE_NA EVENT
---------- -------- -------------------------------- ---------- ------------------------------
       143 ACTIVE   ADHOC_QUERYS		     S_ADHOC	resmgr:cpu quantum
       148 ACTIVE   ADHOC_QUERYS		     S_ADHOC	resmgr:cpu quantum
       150 ACTIVE   ADHOC_QUERYS		     S_ADHOC	resmgr:cpu quantum
       151 ACTIVE   ADHOC_QUERYS		     S_ADHOC	resmgr:cpu quantum
       152 ACTIVE   ADHOC_QUERYS		     S_ADHOC	resmgr:cpu quantum
       156 ACTIVE   ADHOC_QUERYS		     S_ADHOC	resmgr:cpu quantum
       157 ACTIVE   ADHOC_QUERYS		     S_ADHOC	resmgr:cpu quantum
       159 ACTIVE   ADHOC_QUERYS		     S_ADHOC	resmgr:cpu quantum
       162 ACTIVE   ADHOC_QUERYS		     S_ADHOC	resmgr:cpu quantum

This wait event basically states that a session exists and is waiting for the allocation of a quantum of CPU. It is basically DBRM doing his job, throttling CPU allocation until it is according the plan directives that we have defined. It is then obvious if you want to reduce the persistence of this wait event (AWR will help you checking that), you have to increase your CPU allocation (your plan directives) to avoid waiting so much on it.
Another (and the best way to do it, since it gives you a lot of information) is to check the trace file that we’ve generated before:

*** 2014-06-13 17:06:39.844
WAIT #140096016814088: nam='resmgr:cpu quantum' ela= 807849 location=2 consumer group id=88620  =0 obj#=88623 tim=1402675599844408
WAIT #140096016814088: nam='Disk file operations I/O' ela= 5589 FileOperation=2 fileno=0 filetype=15 obj#=88623 tim=1402675599854817

*** 2014-06-13 17:06:40.778
WAIT #140096016814088: nam='resmgr:cpu quantum' ela= 821271 location=3 consumer group id=88620  =0 obj#=88623 tim=1402675600778500

*** 2014-06-13 17:06:41.736
WAIT #140096016814088: nam='resmgr:cpu quantum' ela= 917063 location=3 consumer group id=88620  =0 obj#=88623 tim=1402675601736754

*** 2014-06-13 17:06:42.605
WAIT #140096016814088: nam='resmgr:cpu quantum' ela= 859088 location=3 consumer group id=88620  =0 obj#=88623 tim=1402675602605611

*** 2014-06-13 17:06:43.612
WAIT #140096016814088: nam='resmgr:cpu quantum' ela= 905964 location=3 consumer group id=88620  =0 obj#=88623 tim=1402675603612339
WAIT #140096016814088: nam='direct path read' ela= 1332 file number=4 first dba=16130 block cnt=62 obj#=88623 tim=1402675603682243

Some interesting info here:

ela – Amount time in microseconds that the session spent waiting for a CPU quantum allocation. If we sum everything (all the microseconds) we will have the total time of the session that is “out of CPU”;
consumer group id– The consumer group id, maps with DBA_RSRC_CONSUMER_GROUPS view;
obj# – The object that is part of the wait itself. On our case, it is a table. Maps directly with view DBA_OBJECTS.

Of course if we use tkprof to help us, we can have a more broader picture showing that one of our 20 sessions waited 391,34 seconds during his lifetime and waited for a maximum of 1,10 seconds for a CPU quantum allocation.

Elapsed times include waiting on following events:
  Event waited on                             Times   Max. Wait  Total Waited
  ----------------------------------------   Waited  ----------  ------------
  SQL*Net message to client                       2        0.00          0.00
  SQL*Net message from client                     1        0.00          0.00
  cursor: pin S wait on X                         1        0.14          0.14
  resmgr:cpu quantum                            511        1.10        391.34
  Disk file operations I/O                        4        0.00          0.01
  direct path read                              105        0.30          0.96

Conclusions:

– Use math to define correctly your CPU allocation in DBRM plans and be careful with over and under allocations as they impact your database performance.
– Always try to test your DBRM implementation before go live. Sometimes complex plans can be tricky to test and if you can’t measure the impact you can be in trouble. Trial and error is not a problem, when you are not live.
– Understand how DBRM works! DBRM is a complex beast and i hope that this mini-series can help on that.

Resource Manager – CPU allocation math – Part 2

As said in Part 1, the Part 2 will focus to measure how Oracle will effectively redistribute the CPU allocation defined in previous part. This is a important step while testing Resource Manager, it is very important to test your plans to ensure that Oracle behavior is according of what you are expecting.

Measure CPU allocation it is not a easy task, fortunately Oracle provide us some views related to Resource Manager to help us on this task.
First things first, after creating consumer groups, usernames, roles, plan and plan directives it is mandatory to tell Oracle what is the plan we are going to use. For that use the parameter resource_manager_plan

SQL> alter system set resource_manager_plan='DW_PLAN' scope=both;
System altered.

To measure the CPU allocation, it is necessary to create some heavy cpu loading tasks that use specified database services (as we defined as consumer group mapping). I’ve created 3 simple scripts that burn CPU for each service. The statement is a heavy CPU oriented as you can see bellow:

[oracle@phoenix resource_manager]$  cat cpu_alloc_burn.sql
SET TERMOUT OFF
select distinct t1.N2 from t1, t2
where t1.N1<>t2.N2
and t1.N3<>t2.N1
and t1.N2 <> t2.N1
and t2.N2 is not null;

To fire up the 20 sessions for each service. Bellow is an example for the database service S_DAILY_LOAD

echo "Starting 20 new executions in S_DAILY_LOAD service"
sqlplus -s dw_user/dw_user@S_DAILY_LOAD @cpu_alloc_burn.sql &

[oracle@phoenix resource_manager]$  ./run_adhoc.sh
Starting 20 new executions for S_ADHOC service...
[oracle@phoenix resource_manager]$  ./run_daily_load.sh
Starting 20 new executions in S_DAILY_LOAD service
[oracle@phoenix resource_manager]$  ./run_reporting.sh
Starting 20 new executions for S_REPORTING service...

Now that we are burn heavily our cpu, let’s check Oracle view to ensure that session are in the correct resource consumer group.


SQL> select distinct username, resource_consumer_group, service_name from gv$session
where resource_consumer_group in ('ADHOC_QUERYS', 'DAILY_LOAD', 'REPORTING')
and status= 'ACTIVE'
order by resource_consumer_group;

USERNAME		       RESOURCE_CONSUMER_GROUP		SERVICE_NAME
------------------------------ -------------------------------- ----------------------------------------------------------------
DW_USER 		       ADHOC_QUERYS			S_ADHOC
DW_USER 		       DAILY_LOAD			S_DAILY_LOAD
DW_USER 		       REPORTING			S_REPORTING

Everything sounds good, now it is time to measure CPU activity based on Resource Manager view v$rsrc_consumer_group

SQL> SELECT name,
       active_sessions, execution_waiters, requests,
       cpu_wait_time, cpu_waits, consumed_cpu_time, yields
  FROM v$rsrc_consumer_group
ORDER BY cpu_wait_time;

Resource Manager view

Now it is time for math. The result of the previous query was taken about 5 minutes of running and the math shows us that Resource Manager is not yet “respecting” our CPU allocation according the numbers. As said before, we are probably unable to get a perfect match, but a close match.

Desired scenario:

Resource Manager Real CPU allocation


Real world scenario:
Resource Manager CPU math


To make sure that we can get better numbers i will let the sessions running under DBRM for several minutes, and little better numbers here, still not a perfect match between what we have defined in the first part.
As you can easily see, DAILY_LOAD is consuming 85% of our CPU time according Oracle vs 65% that we had specified. This is also happen with REPORTING a ADHOC_QUERYS with 12,75% and 11,83%.
Our conclusion is for a perfect match you need that consumer group to fully utilize its allocation. That will probably be very difficult. Please also note that for a much more complex plans (with sub plans as example) this task will be harder.

Update:

I’ve let the load scripts to run for about 1 hour to check if the results are more according what we expect from our resource manager CPU allocation. Bellow are the results (in SQL screenshot). The results are much better than the previous 5 minutes attempt:

Resource Manager CPU allocation 1 hour


The next part (Part 3) will be focused on what wait events are present in sessions when Oracle is managing your CPU allocation.

Resource Manager – CPU allocation math – Part 1

It is often a underestimate feature on Oracle Databases (changed a little bit with Exadata), Resource Manager is a very powerful feature that allows you to manage different workloads within a database. As you know hardware resources are limited and it is often necessary the proper allocation of resources to different tasks so it is Resource Manager job to handle these common problems these days.
This post will cover only CPU allocation (in a simple way) to different tasks or users. Understand the basis of CPU allocation from Resource Manager point of view will help to define a better plan to handle a proper allocation of your CPU resources.

Resource Manager is made of three components: consumer group, plan directives and resource plans.
Basically the consumer group is a group that aggregates and share common priority and scheduling. As example, in a datawarehousing evironment a “Reporting” group will share the same business priority.
In other way, plan directives is a link between a consumer group and a resource plan. It allows you to define the resource allocation. It is a one-to-one relationship and is a list of dictionary key value attributes.
In the end, resource plan is a collection of directives that will determine how of resources are allocated.Only one resource plan is allowed per instance.

Please note before continue that this post is not intended to explain Resource Manager in detail.

1 – The setup and example

We will setup a fairly simple use case. Let’s pretend that we have a datawarehousing system that has the following business rules. These rules have different CPU allocation priorities, based on business requirements:

DAILY_LOAD: Daily data-load from several OLTP databases;
REPORTING: Reporting tasks and services;
ADHOC_QUERY: Adhoc querys issued by users.

The following PL/SQL will create four consumer groups that will allow us to respect business priorities. The CPU priority will be defined at plan directive creation.

BEGIN
  dbms_resource_manager.clear_pending_area();
  dbms_resource_manager.create_pending_area();
  dbms_resource_manager.create_consumer_group(
    consumer_group => 'DAILY_LOAD',
    comment        => 'Consumer group for critical OLTP applications');
  dbms_resource_manager.create_consumer_group(
    consumer_group => 'REPORTING',
    comment        => 'Consumer group for long-running reports');
  dbms_resource_manager.create_consumer_group(
    consumer_group => 'ADHOC_QUERYS',
    comment        => 'Consumer group for adhoc querys');
  dbms_resource_manager.validate_pending_area();
  dbms_resource_manager.submit_pending_area();
END;

Apart from this let’s create three difference services and one particular database user to ensure the following mapping.

BEGIN
  dbms_resource_manager.clear_pending_area();
  dbms_resource_manager.create_pending_area();
  dbms_resource_manager.set_consumer_group_mapping(
    attribute      => dbms_resource_manager.service_name,
    value          => 'S_DAILY_LOAD',
    consumer_group => 'DAILY_LOAD');
  dbms_resource_manager.set_consumer_group_mapping(
    attribute      => dbms_resource_manager.service_name,
    value          => 'S_ADHOC',
    consumer_group => 'ADHOC_QUERY');
  dbms_resource_manager.set_consumer_group_mapping(
    attribute      => dbms_resource_manager.service_name,
    value          => 'S_REPORTING',
    consumer_group => 'REPORTING');
  dbms_resource_manager.submit_pending_area();
END;
BEGIN
  dbms_resource_manager_privs.grant_switch_consumer_group(
    GRANTEE_NAME   => 'ROLE_DW',
    CONSUMER_GROUP => 'DAILY_LOAD',
    GRANT_OPTION   =>  FALSE);
  dbms_resource_manager_privs.grant_switch_consumer_group(
    GRANTEE_NAME   => 'ROLE_DW',
    CONSUMER_GROUP => 'ADHOC_QUERY',
    GRANT_OPTION   =>  FALSE);
  dbms_resource_manager_privs.grant_switch_consumer_group(
    GRANTEE_NAME   => 'ROLE_DW',
    CONSUMER_GROUP => 'REPORTING',
    GRANT_OPTION   =>  FALSE);

END;

The mapping defined is the following:

– Users that connect to service S_DAILY_LOAD, S_ADHOC or S_REPORTING will be switched to the corresponding consumer group. Please note that all users that connect to application have the role ROLE_DW, avoiding specifing each individual database username.

– The last PL/SQL block will grant user that their session is able to switch to consumer group. This is mandatory for DBRM to be able to automatically switch your session. Even if you have a mapping that is based on service_name, module_name, client_os_user etc, your grant to switch need to be at username level. I’ve had a little discussion on this topic with Martin Bach during OUGN14 and so far is the only way to do it.

The next step is to create the plan and the plan directive. As it is a simple example, it is basically one plan and some directives for each consumer group.

BEGIN
 dbms_resource_manager.clear_pending_area();
 dbms_resource_manager.create_pending_area();
 dbms_resource_manager.create_plan(
   plan    => 'DW_PLAN',
   comment => 'Resource plan for normal business hours');

 dbms_resource_manager.create_plan_directive(
   plan             => 'DW_PLAN',
   group_or_subplan => 'DAILY_LOAD',
   comment          => 'DW Daily load from OLTP',
   mgmt_p1          => 65);
 dbms_resource_manager.create_plan_directive(
   plan             => 'DW_PLAN',
   group_or_subplan => 'REPORTING',
   comment          => 'Reporting services and tasks - Lower priority',
   mgmt_p2          => 50);
 dbms_resource_manager.create_plan_directive(
   plan             => 'DW_PLAN',
   group_or_subplan => 'ADHOC_QUERY',
   comment          => 'Adhoc Querys by users',
   mgmt_p2          => 40);
 dbms_resource_manager.create_plan_directive(
   plan             => 'DW_PLAN',
   group_or_subplan => 'OTHER_GROUPS',
   comment          => 'All other groups',
   mgmt_p3          => 100);
 dbms_resource_manager.validate_pending_area();
 dbms_resource_manager.submit_pending_area();
END;

2 – The formula for CPU plan allocation

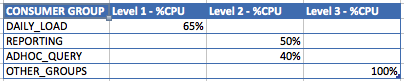
In the previous setup, we decided to specify the following CPU percentages for each task. As you can see, you can’t simply sum all the values at they are at different levels (mgmt_pN) and the sum of all values is over 100% of CPU allocation.

Resource Manager CPU allocation


The formula for calculation CPU allocation of each level is the following:

Level N = (100 – SUM(L1)) x (100 – SUM(L2)) x (100 – SUM(L3)) … x Level N

Please note that for Level 1 or mgmt_1 there is not formula needed, just the value you setup in mgmt_p1.

In our case, the calculations are:

Level 1 (DAILY_LOAD) = 65%
Level 2
(REPORTING) = (100 – 65%) x 50% = 17,5%
Level 2 (ADHOC_QUERY) = (100 – 65%) x 40% = 14%
Level 3
(OTHER_GROUPS) = (100-65%) x (100% – SUM(50%+40%)) x 100% = 3,5%

Above is the summary of real CPU allocation, with a total of 100%. That means that all of CPU resources will be distributed across your priority and preferences. Of course, getting a perfect match between the CPU allocation that you setup and the real case scenario can be fairly difficult but a very approximate value is expected. Part 2 of these article will be focused on doing some test trying to measure a real case scenario.

Resource Manager Real CPU allocation


Have a nice weekend.